
Key Features
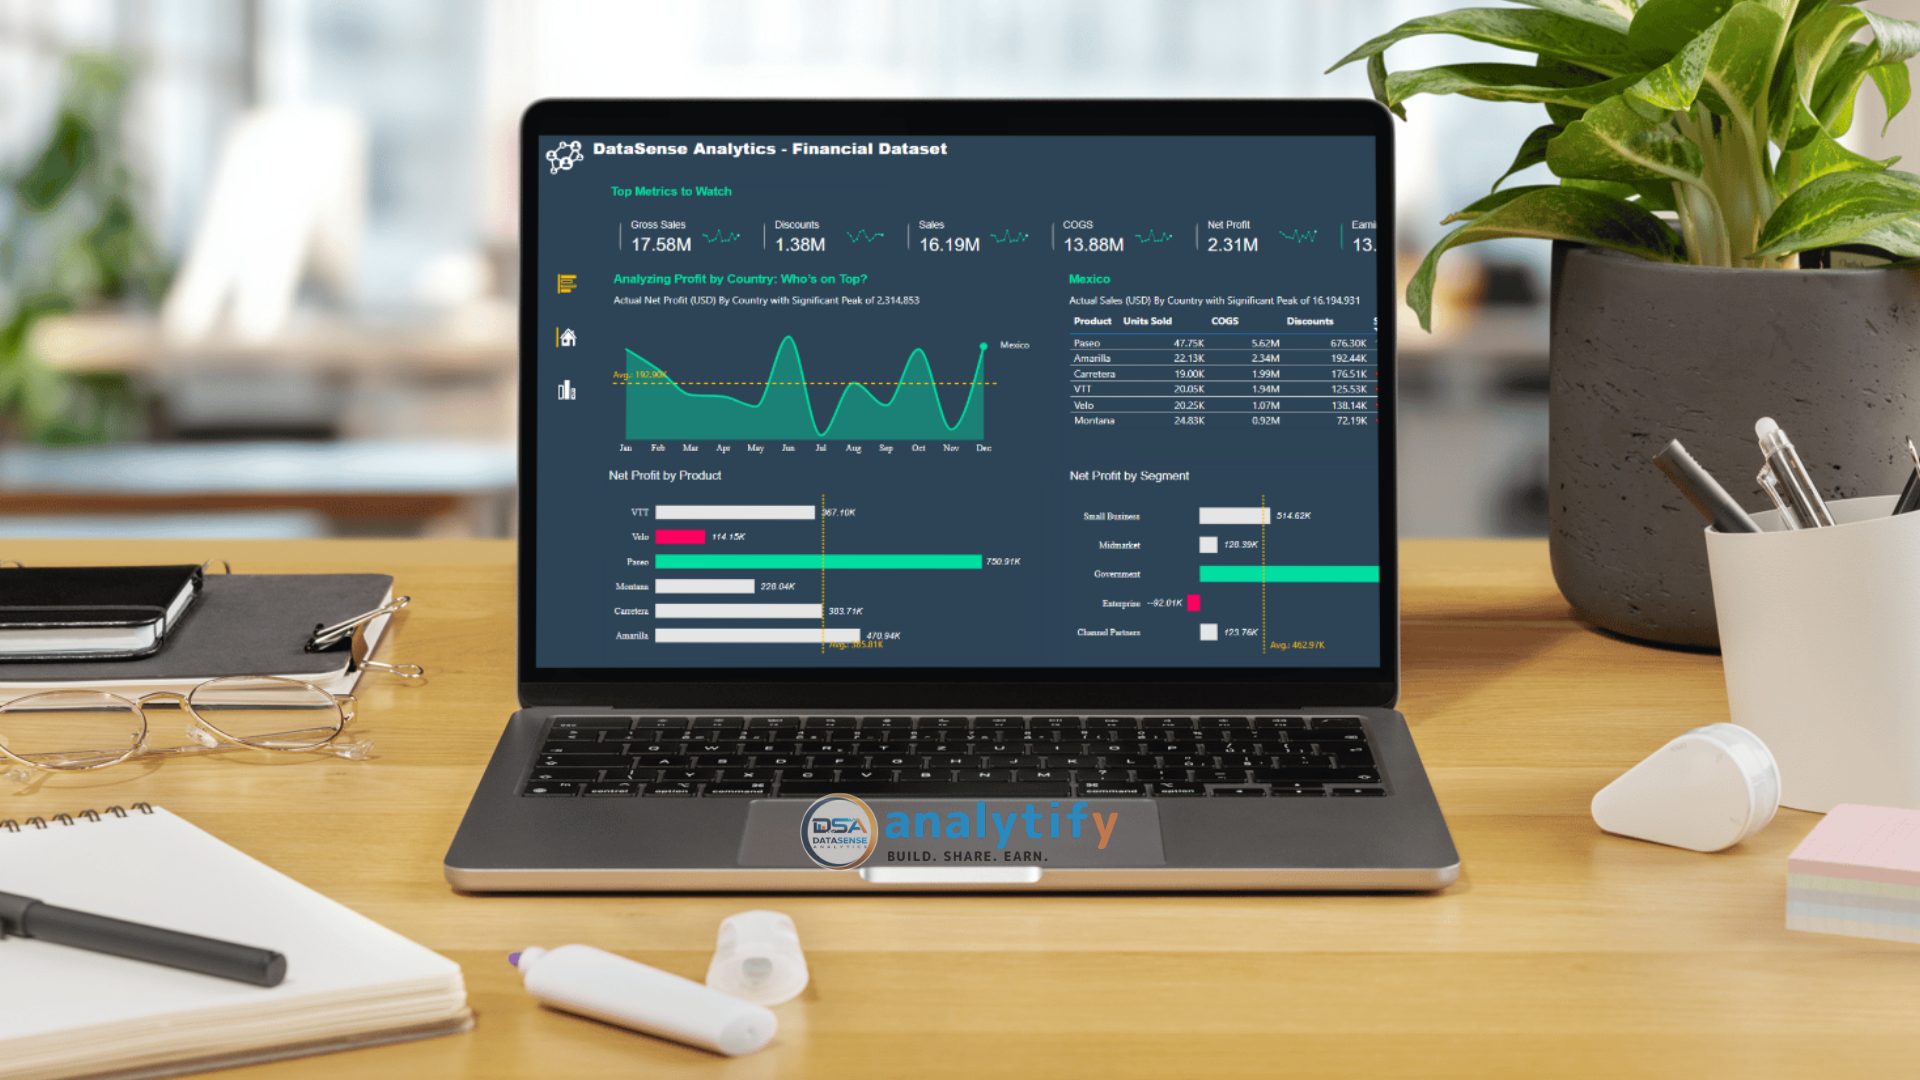
- Top Financial Metrics
Highlights essential indicators used to evaluate overall financial health, such as gross sales, applied discounts, and earnings percentages. - Profit Analysis by Geographic Region
Identifies regions driving profitability and examines trends in earnings distribution across different locations. - Profit Distribution Across Product Lines
Shows how profit contributions vary between product categories, emphasizing high-performing and underperforming offerings. - Product-wise Financial Breakdown
Provides detailed insights into cost structures, discount impacts, and revenue generation for individual products. - Profit Segmentation by Business Segments
Categorizes earnings based on customer or organizational segments, such as enterprise, government, or channel partnerships.
Elevate your data experience with our customizable Power BI templates. Perfect for a wide range of needs, these templates help you organize, analyze, and visualize your data in an efficient way.
Special Offer: Get the Personal Money Manager Dashboard FREE!
When you purchase any of our Power BI templates, you’ll receive the Personal Money Manager Dashboard for FREE! This helpful template is designed to manage and track your personal finances.


