
Key Features
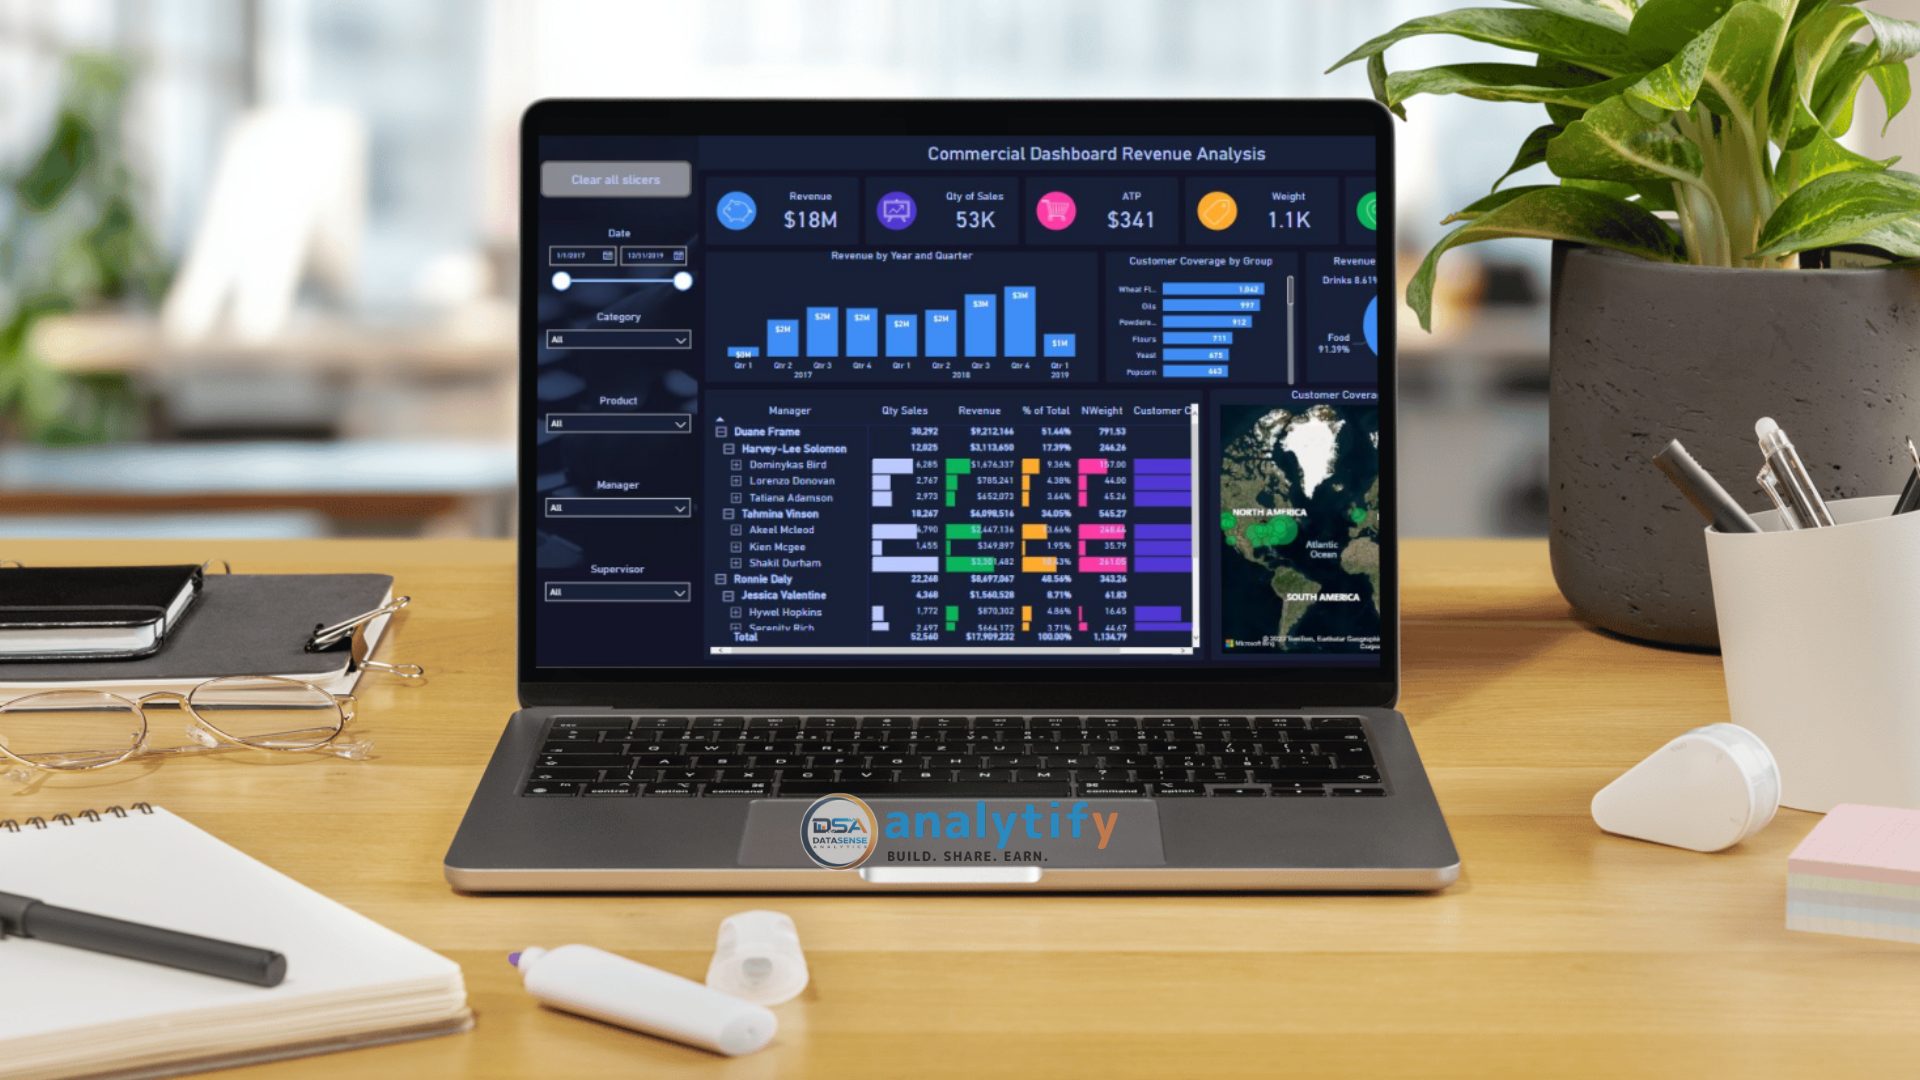
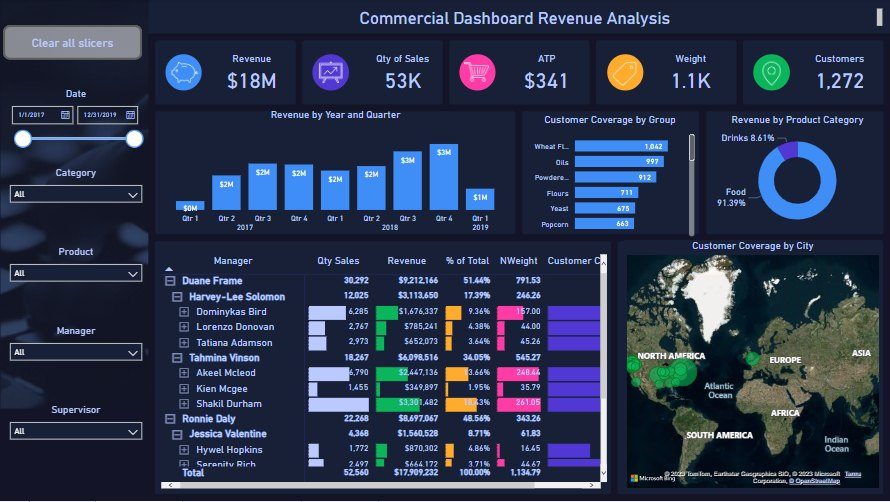
- Revenue and Sales Overview – Summarizes key performance metrics, offering a quick snapshot of business performance.
- Revenue Trends by Year and Quarter – Visualizes revenue distribution over time to identify growth patterns and seasonal trends.
- Customer and Product Insights – Highlights customer distribution and product category contributions for market analysis.
- Sales Performance by Representative – Ranks sales representatives based on revenue, sales percentage, and product weight.
- Geographical Coverage – Uses a map to display customer distribution and market reach across regions.
Elevate your data experience with our customizable Power BI templates. Perfect for a wide range of needs, these templates help you organize, analyze, and visualize your data in an efficient way.
Special Offer: Get the Personal Money Manager Dashboard FREE!
When you purchase any of our Power BI templates, you’ll receive the Personal Money Manager Dashboard for FREE! This helpful template is designed to manage and track your personal finances.


